Two breast PDO studies pair antibody/nanobody distribution with ADC-associated morphology and viability to guide imaging, dose design and efficacy comparisons.
01Study objective02Model & design03Assays & findings04Decision & next step
Model & sampleBreast cancer PDO with antibody/nanobody distribution imaging
ObjectiveConnect antibody/nanobody frozen-section imaging with ADC dose-response studies
Study setupAF549-labeled antibody/nanobody imaging and ADC dose conditions
AssaysBright-field, fluorescence imaging, tissue distribution and viability readouts
Study evidenceTRiCBIO antibody/nanobody distribution and ADC activity study data
DeliverablesDeliverables are defined by the study scope and may include images, assay results, an analysis summary, methods and a study report
STUDY EVIDENCE
Breast cancer PDO studies: distribution imaging and ADC response
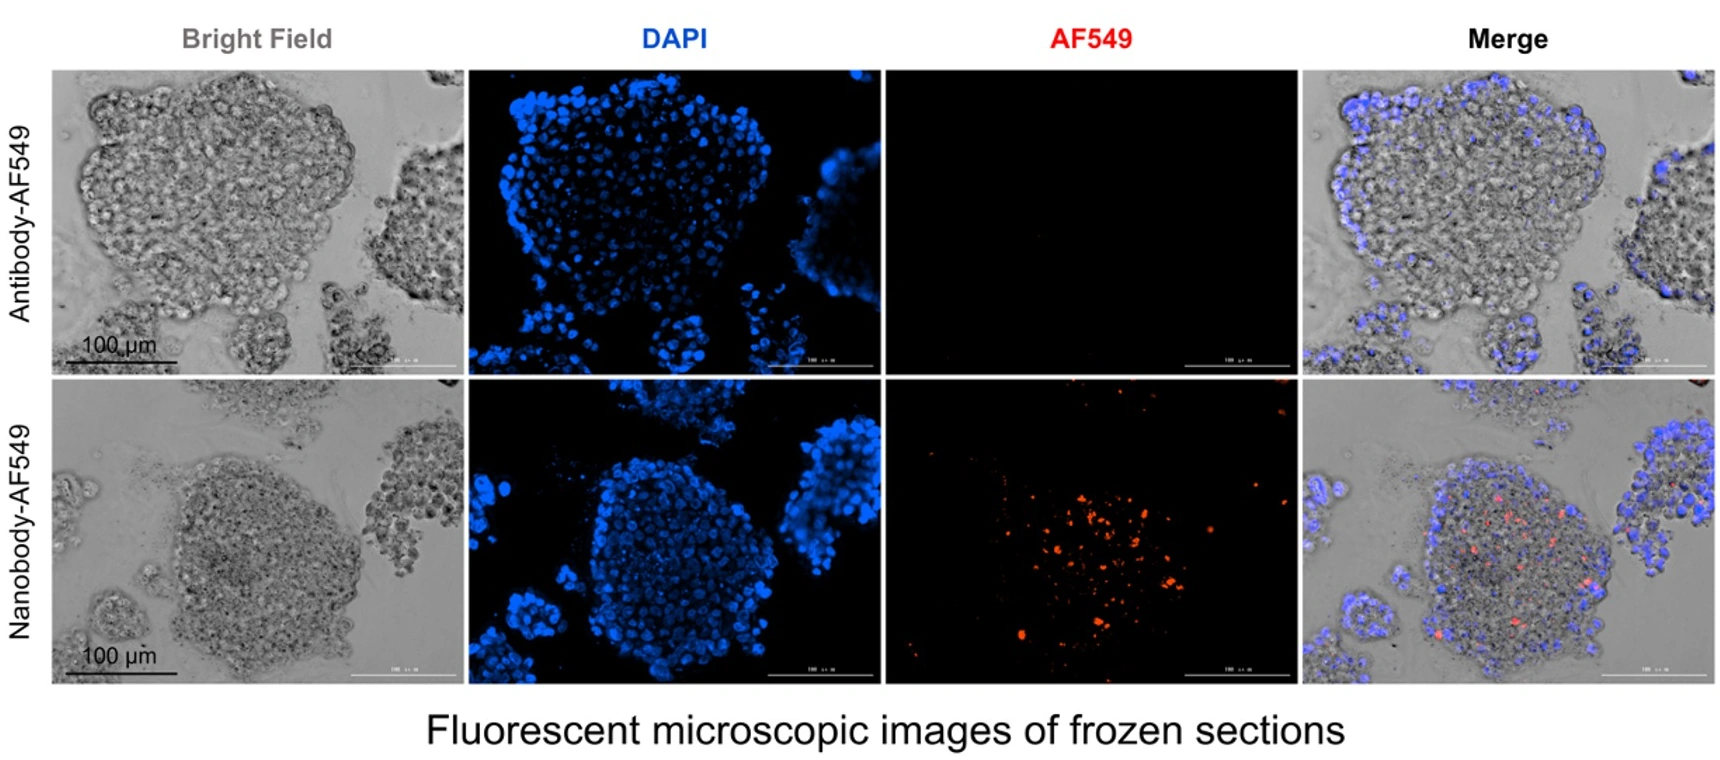
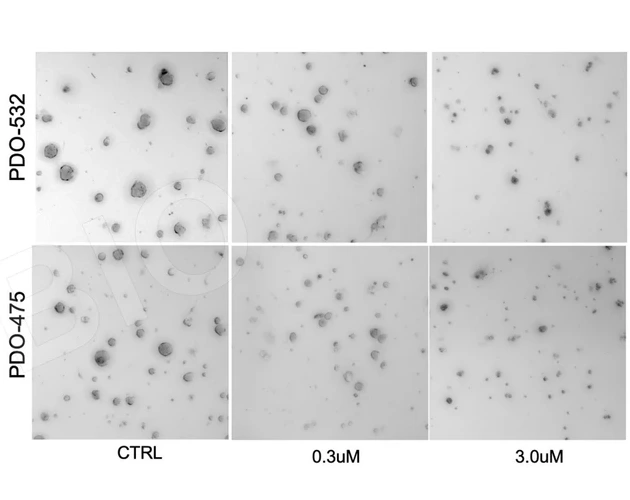
Breast cancer PDO studies combine frozen-section distribution of labeled antibody/nanobody formats with post-ADC morphology and dose response to inform molecular format, imaging conditions and candidate evaluation.
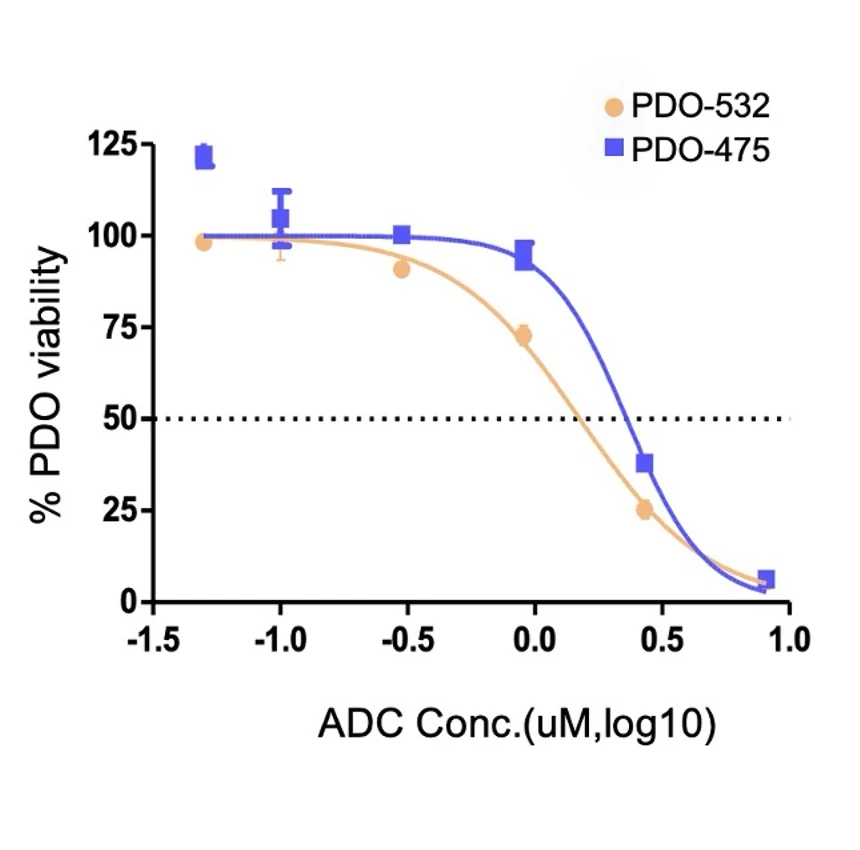
The curves show different viability profiles across a candidate ADC concentration range in two PDO models, with replication and statistical analysis supporting dose-window selection and follow-on candidate comparison.
Compares model-level response differences and informs follow-on sample studies
INTERPRETATION
Compare candidates through spatial distribution and activity
How the results are used
Plan ADC imaging, dose selection and candidate comparisons using labeled-antibody/nanobody distribution and ADC activity readouts.
Study application
For a new ADC program, spatial imaging and activity testing can be combined in one study to connect target expression, tissue distribution and response.
Follow-on study
Evaluate target profiling, competition controls and time-course imaging alongside apoptosis and independent-sample results.
Related models and services
Choose the right models and services for the next study
Two breast PDO studies pair antibody/nanobody distribution with ADC-associated morphology and viability to guide imaging, dose design and efficacy comparisons.
01Study objective02Model & design03Assays & findings04Decision & next step
Model & sampleBreast cancer PDO with antibody/nanobody distribution imaging
ObjectiveConnect antibody/nanobody frozen-section imaging with ADC dose-response studies
Study setupAF549-labeled antibody/nanobody imaging and ADC dose conditions
AssaysBright-field, fluorescence imaging, tissue distribution and viability readouts
Study evidenceTRiCBIO antibody/nanobody distribution and ADC activity study data
DeliverablesDeliverables are defined by the study scope and may include images, assay results, an analysis summary, methods and a study report
STUDY EVIDENCE
Breast cancer PDO studies: distribution imaging and ADC response
Breast cancer PDO studies combine frozen-section distribution of labeled antibody/nanobody formats with post-ADC morphology and dose response to inform molecular format, imaging conditions and candidate evaluation.
The curves show different viability profiles across a candidate ADC concentration range in two PDO models, with replication and statistical analysis supporting dose-window selection and follow-on candidate comparison.
Compares model-level response differences and informs follow-on sample studies
INTERPRETATION
Compare candidates through spatial distribution and activity
How the results are used
Plan ADC imaging, dose selection and candidate comparisons using labeled-antibody/nanobody distribution and ADC activity readouts.
Study application
For a new ADC program, spatial imaging and activity testing can be combined in one study to connect target expression, tissue distribution and response.
Follow-on study
Evaluate target profiling, competition controls and time-course imaging alongside apoptosis and independent-sample results.
Related models and services
Choose the right models and services for the next study